Course Introduction
Course Overview:
This intensive 2-day training program equips professionals with the skills to perform robust statistical analyses using Excel and GRETL (GNU Regression, Econometrics, and Time-Series Library), a free, open-source software renowned for its versatility in econometrics and data modeling. Combining foundational statistics with hands-on software application, the course bridges theory and practice, empowering participants to design experiments, analyze datasets, and interpret results confidently. Through real-world case studies, collaborative projects, and guided practice sessions, attendees will gain proficiency in statistical techniques critical for evidence-based decision-making in fields such as economics, public policy, business, and research.
Learning Objectives:
By the end of this course, participants will be able to:
1. Master Statistical Foundations: Apply descriptive statistics, hypothesis testing (t-tests), and experimental design principles to distinguish causal relationships in observational vs. controlled studies.
2. Execute Regression Analysis: Build, diagnose, and interpret linear regression models (simple and multiple OLS) using GRETL, including data transformation and assumption validation.
3. Avoid Common Pitfalls: Identify and address errors in regression analysis, such as multicollinearity, heteroscedasticity, and omitted variable bias.
4. Expand Methodological Toolkit: Explore advanced techniques (logistic regression, panel data, time-series analysis) and their applications.
5. Deliver Actionable Insights: Translate statistical outputs into clear, impactful narratives for stakeholders using Excel visualization tools.
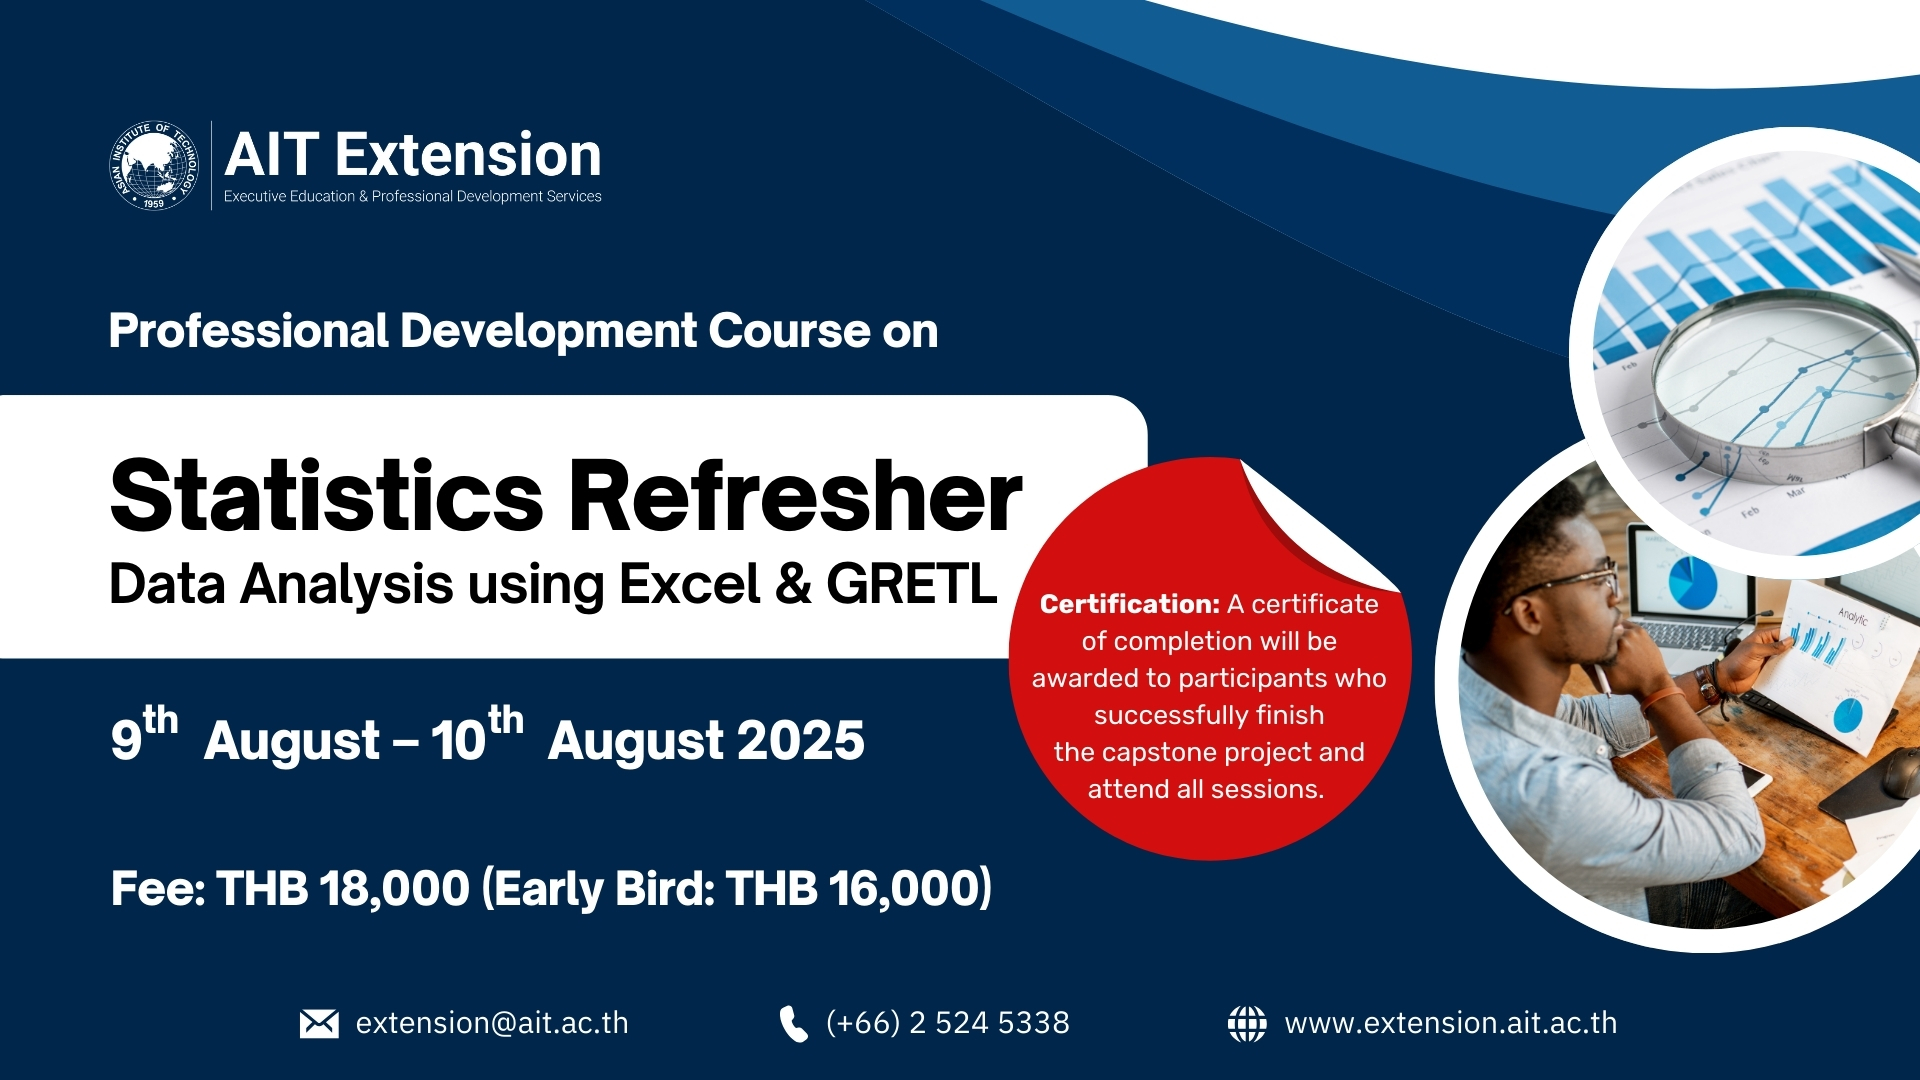
Course Fee: 18000 Thai Baht
Early Bird Fee: 16000 Thai Baht : Apply by 15th June 2025
Course Structure:
Day 1: Foundations of Statistical Analysis
- Session 1: Data Exploration & Descriptive Statistics
- Measures of central tendency, dispersion, and distribution (Excel/GRETL).
- Visualizing data: Histograms, box plots, and scatterplots.
- Session 2: Hypothesis Testing & Experimental Design
- Controlled experiments vs. observational studies: Strengths, limitations, and biases.
- One-sample t-tests, and two-sample difference-in-means tests.
- Hands-On Lab: Analyze real datasets (e.g., public health, economic indicators) to test hypotheses and present findings.
Day 2: Regression Modeling & Advanced Applications
- Session 1: Regression Fundamentals
- Correlation vs. causation: Building simple and multiple OLS models in GRETL.
- Interpreting coefficients, p-values, and R-squared.
- Session 2: Model Diagnostics & Refinement
- Testing OLS assumptions (homoscedasticity, independence of errors, etc.).
- Data transformation techniques (logarithms, dummy variables).
- Session 3: Beyond OLS
- Introduction to logistic regression, panel data analysis, and time-series analysis.
- Case study: Predicting outcomes with non-linear relationships.
- Capstone Project:
- Participants work individually or in groups to analyze a provided dataset, applying regression techniques to answer a research question. Present results with actionable recommendations.
Key Features:
- Software Integration: Step-by-step guidance in Excel (basic analysis/visualization) and GRETL (advanced modeling).
- Real-World Relevance: Case studies from economics, policy, and business to contextualize learning.
- Interactive Learning: Live demonstrations, Q&A sessions, and collaborative problem-solving.
- Take-Home Toolkit: Access to datasets, GRETL scripts, and cheat sheets for future reference.
Who Should Attend:
- Data analysts, researchers, and economists seeking to strengthen their statistical modeling skills.
- Policy professionals and business analysts requiring evidence-based insights for decision-making.
- Academics and students aiming to apply GRETL for thesis or project work.
Prerequisites: Basic familiarity with statistics and Excel. No prior GRETL experience required.
Outcome: Participants will leave with the ability to independently conduct end-to-end statistical analyses, from data preparation to model interpretation, using industry-standard tools.
Certification: A certificate of completion will be awarded to participants who successfully finish the capstone project and attend all sessions.
Duration: 2 days (12 hours total), blending lectures, labs, and project work.
This course transforms raw data into meaningful insights, empowering professionals to drive impact through rigorous statistical analysis.
